User Guide
Navigation

The application consist of 4 pages:
Historical
Diagnostic
Nowcast
Auto Nowcast
Filter
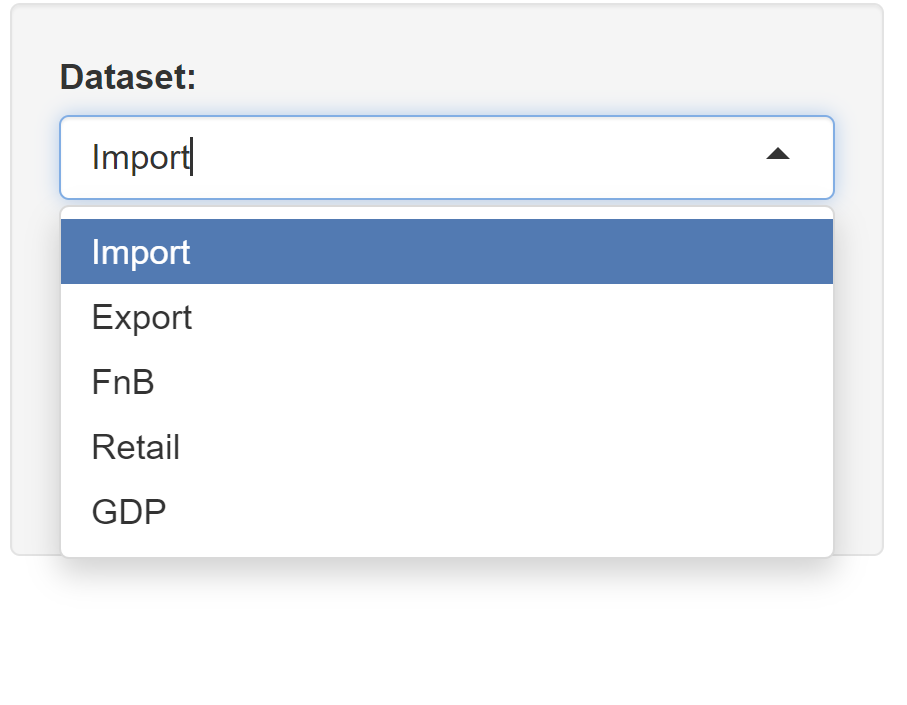
On all the pages, on the left there is a side panel to choose the dataset that wanted to be plotted. There are 5 dataset that could be choosen from:
Export
Import
Fnb
Retail
GDP
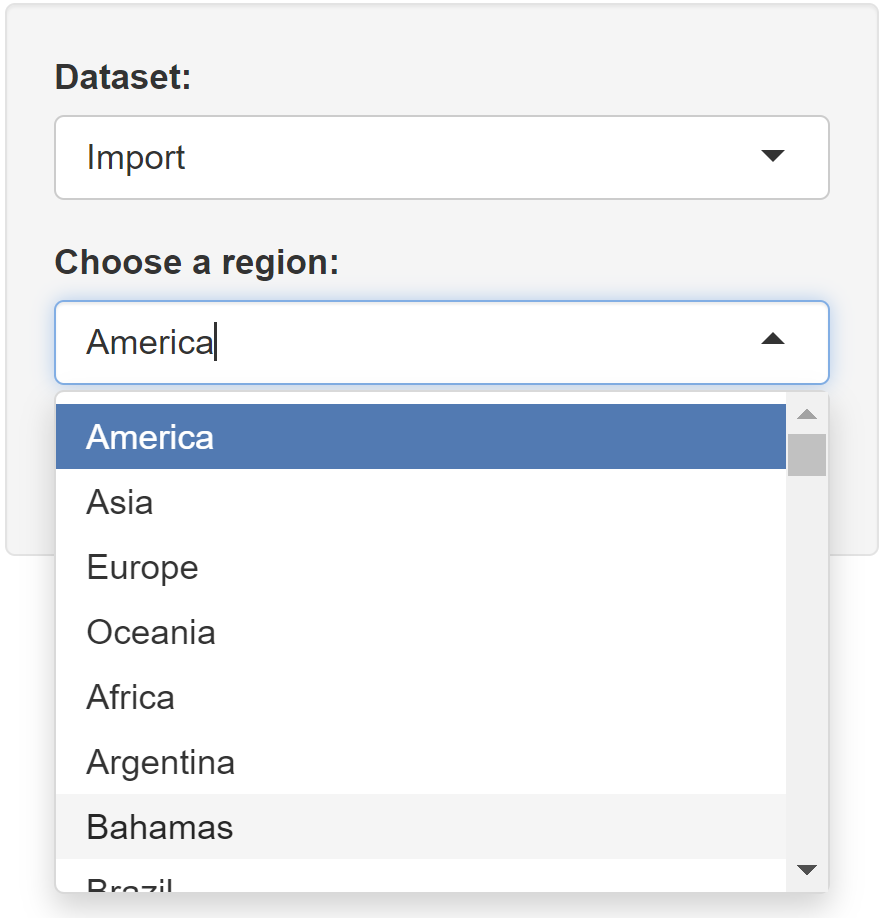
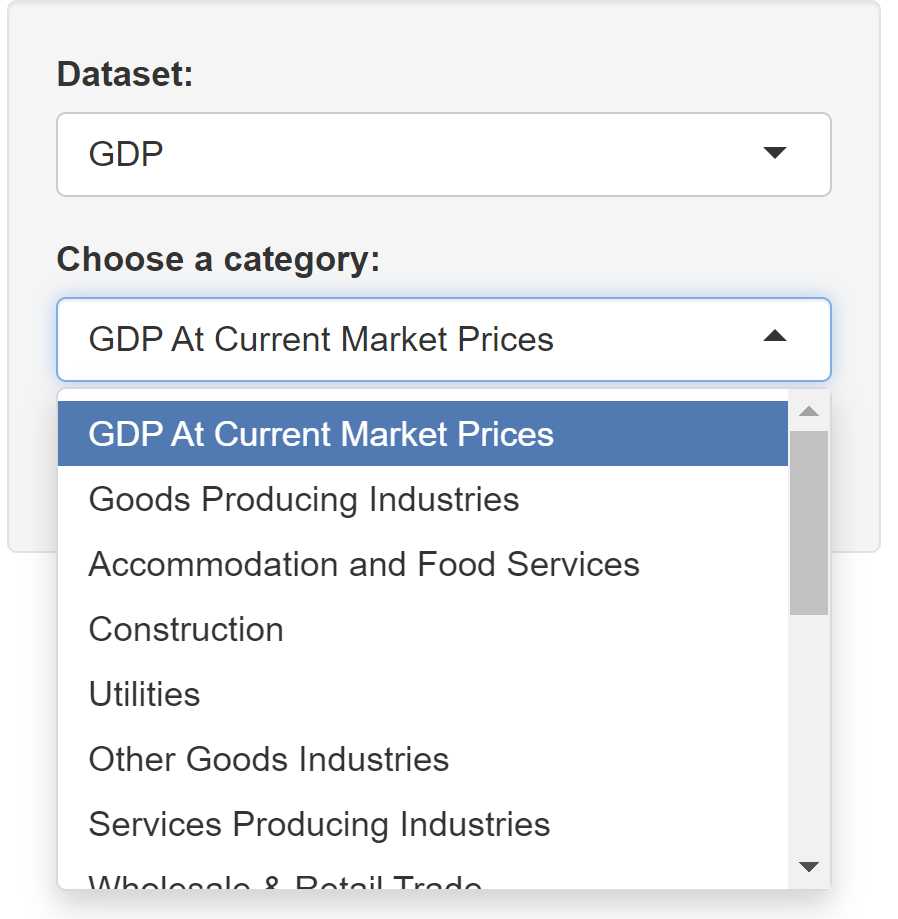
For Export, Import, and GDP when chosen, a new column to choose which region or category will appear.
To generate the correct plot of each page, there is a generate button at the end of the sidebar panel on every page, except Nowcast, since there are further steps needed to be done in Nowcast page.
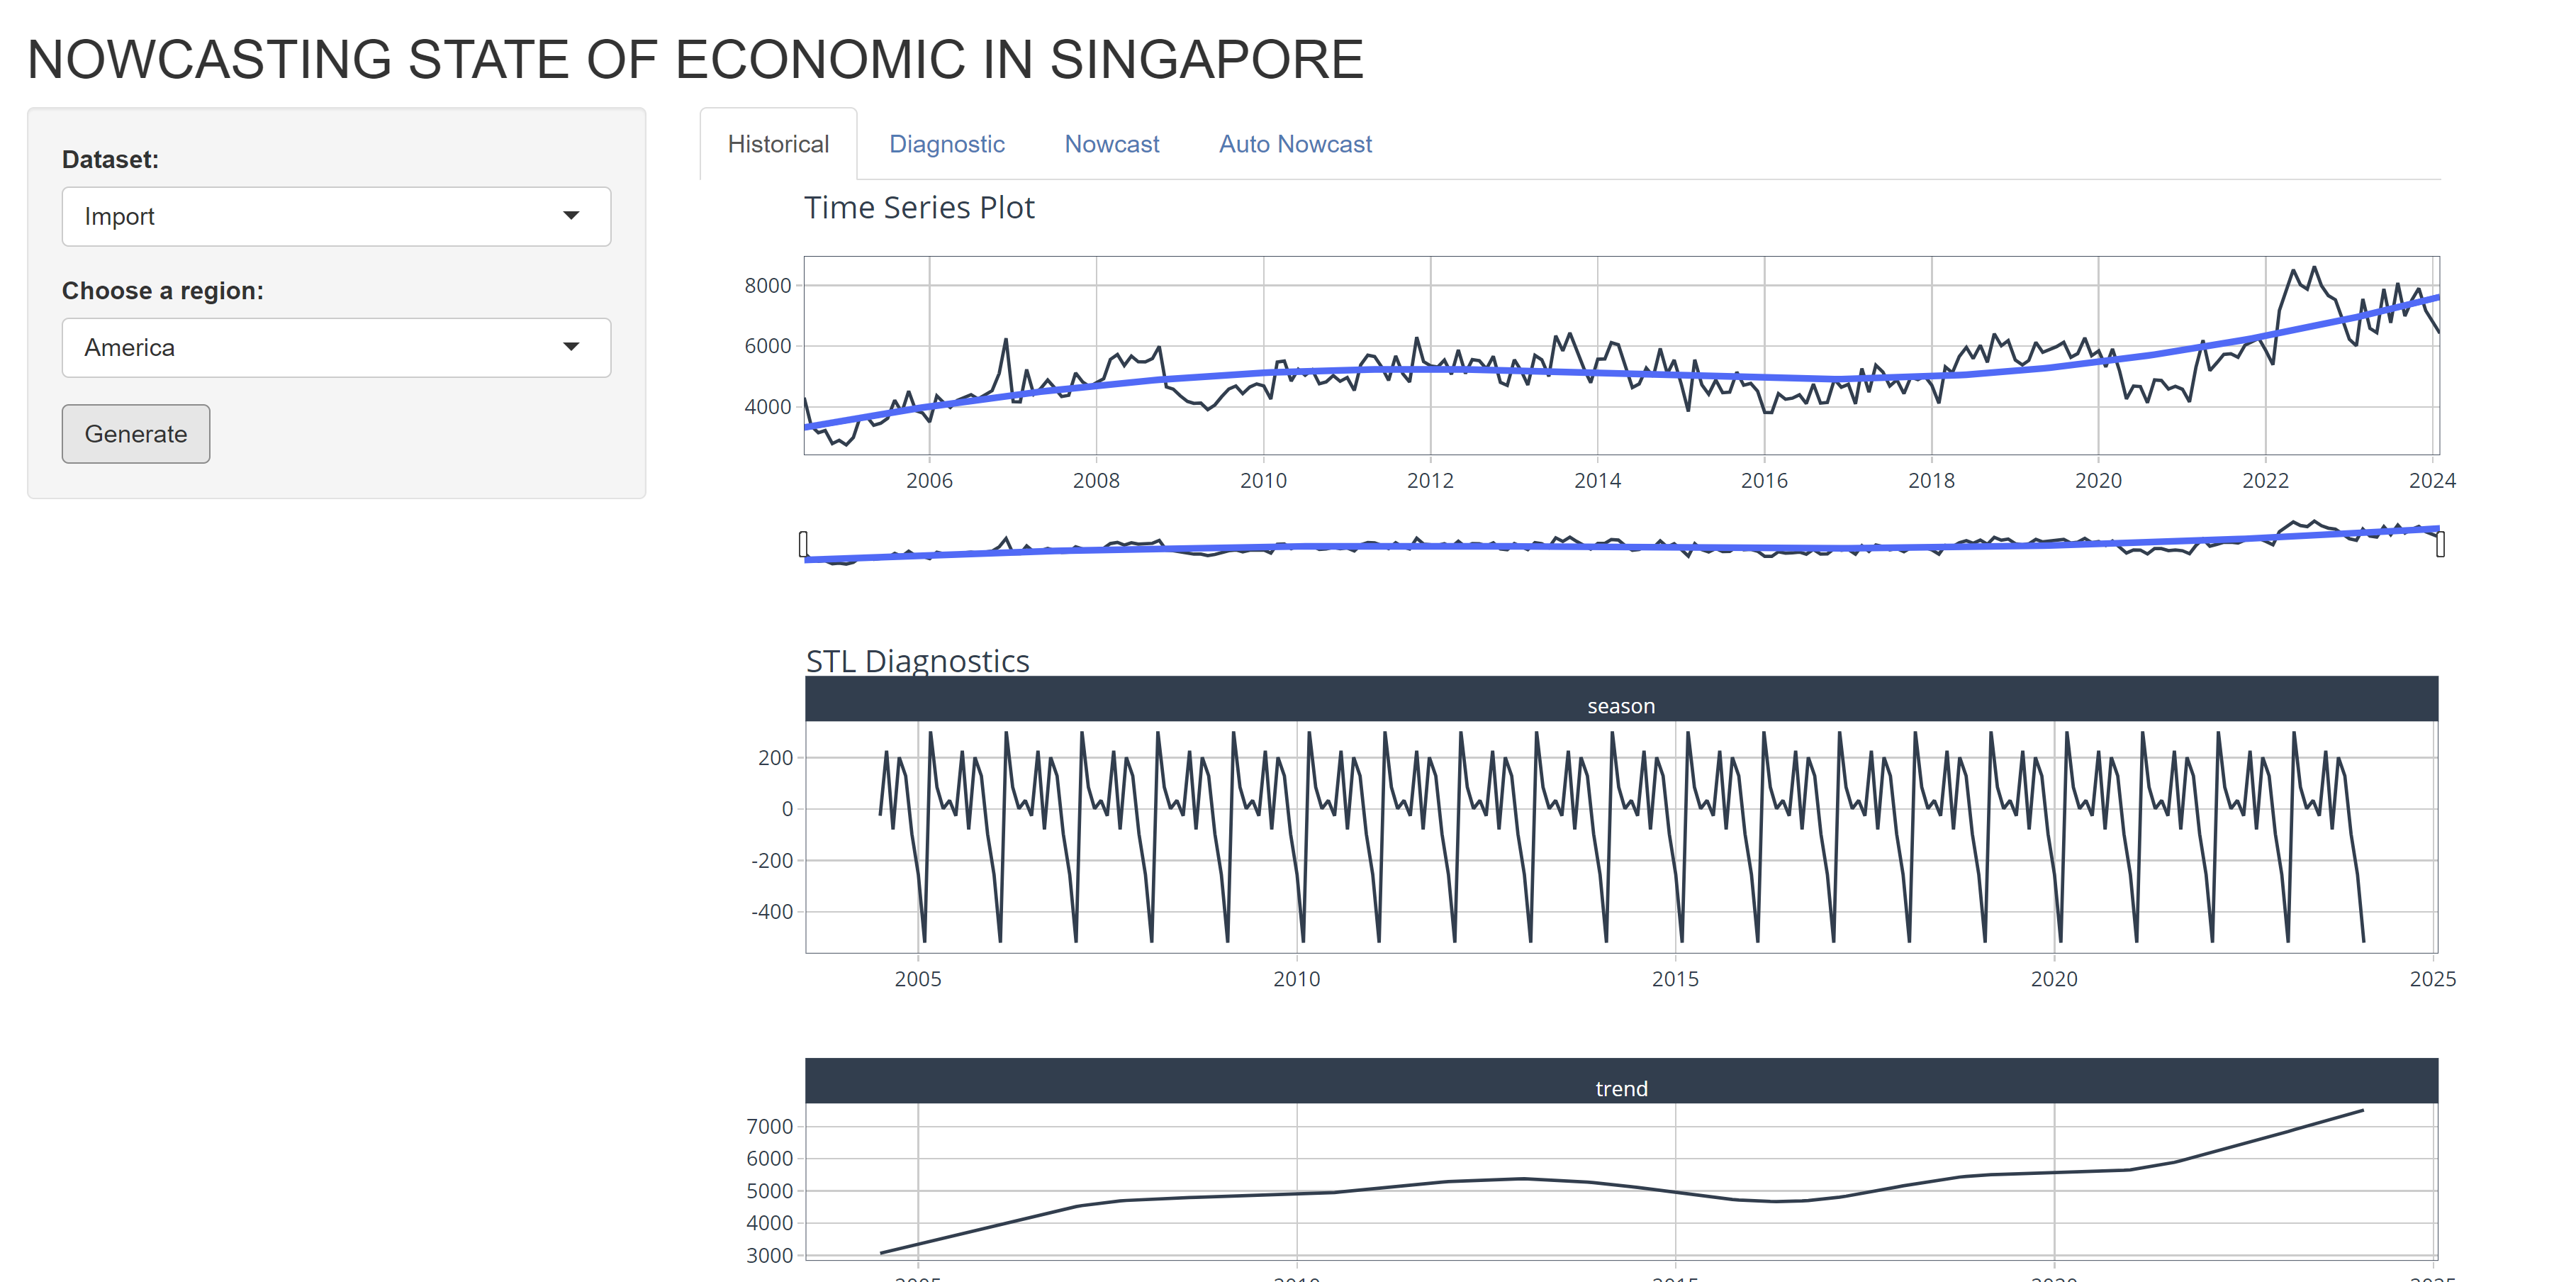
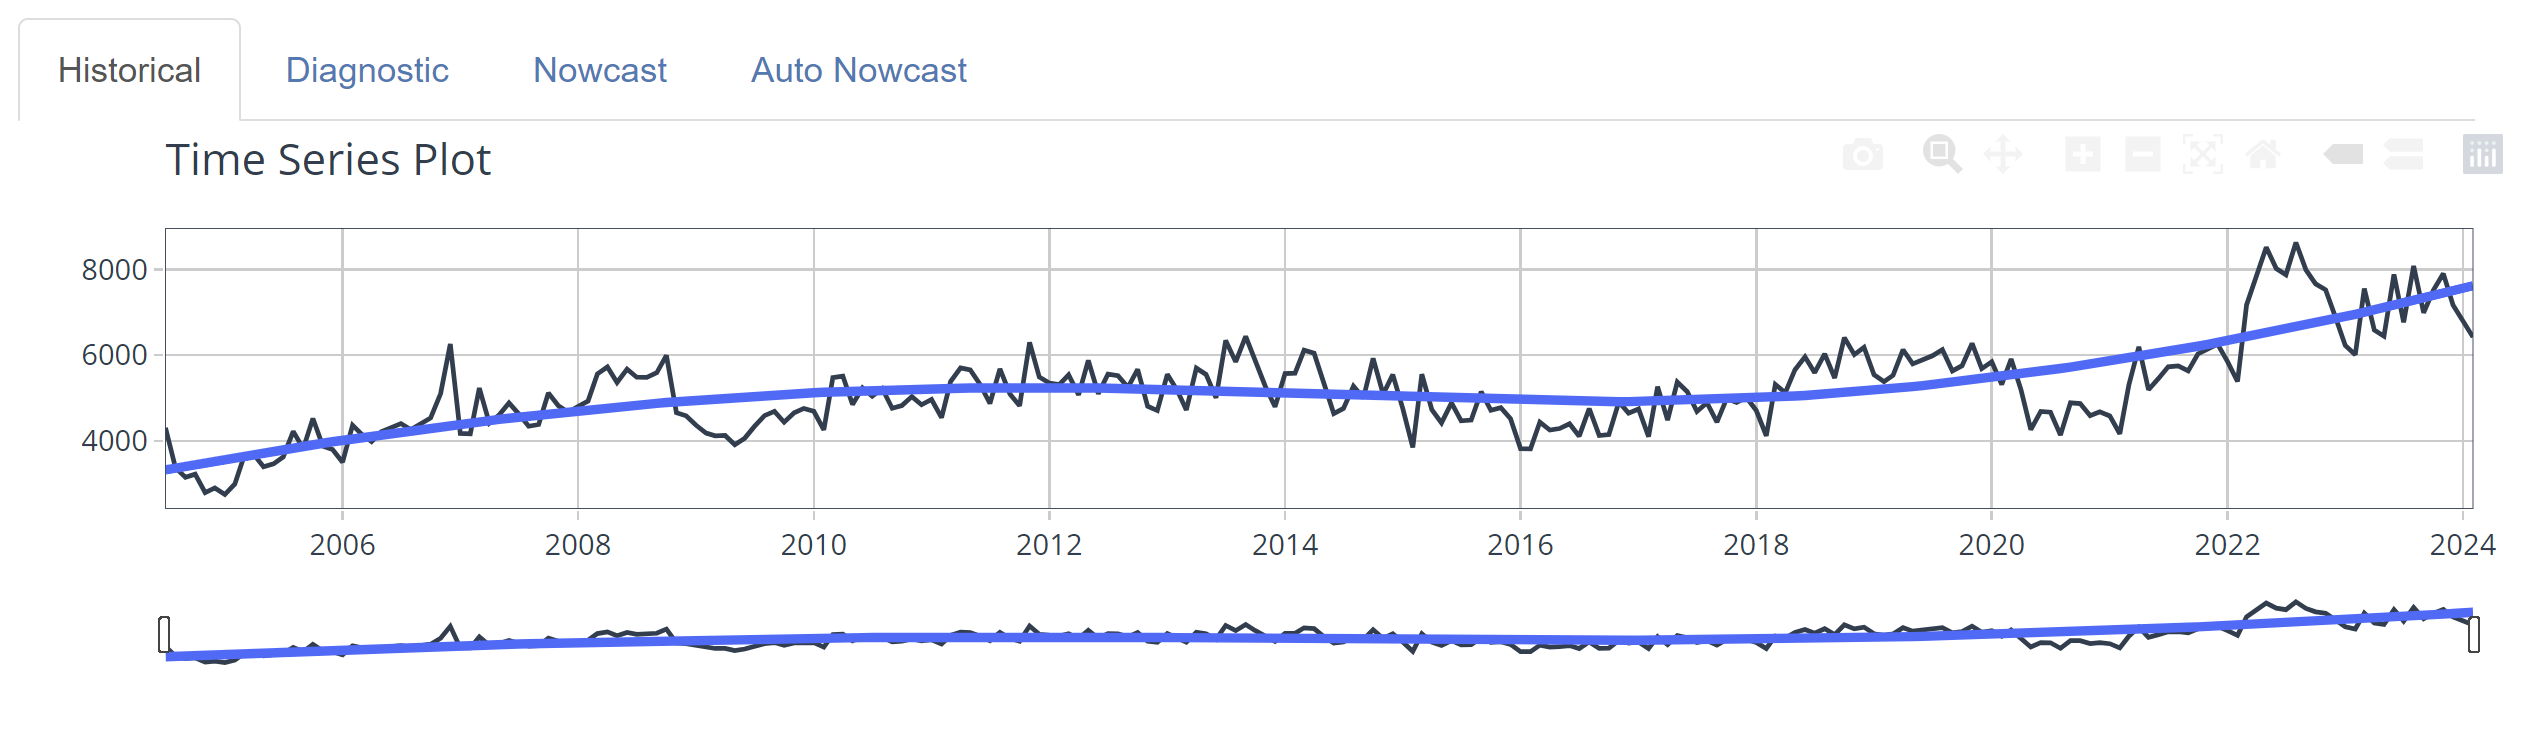
Historical
In this page there are 2 main plot.
The Time Series Plot, this plot was used to show the historical data and the trendline for the data choosen. Under it the a slider bar is used to choose the range of plot that want to be seen.
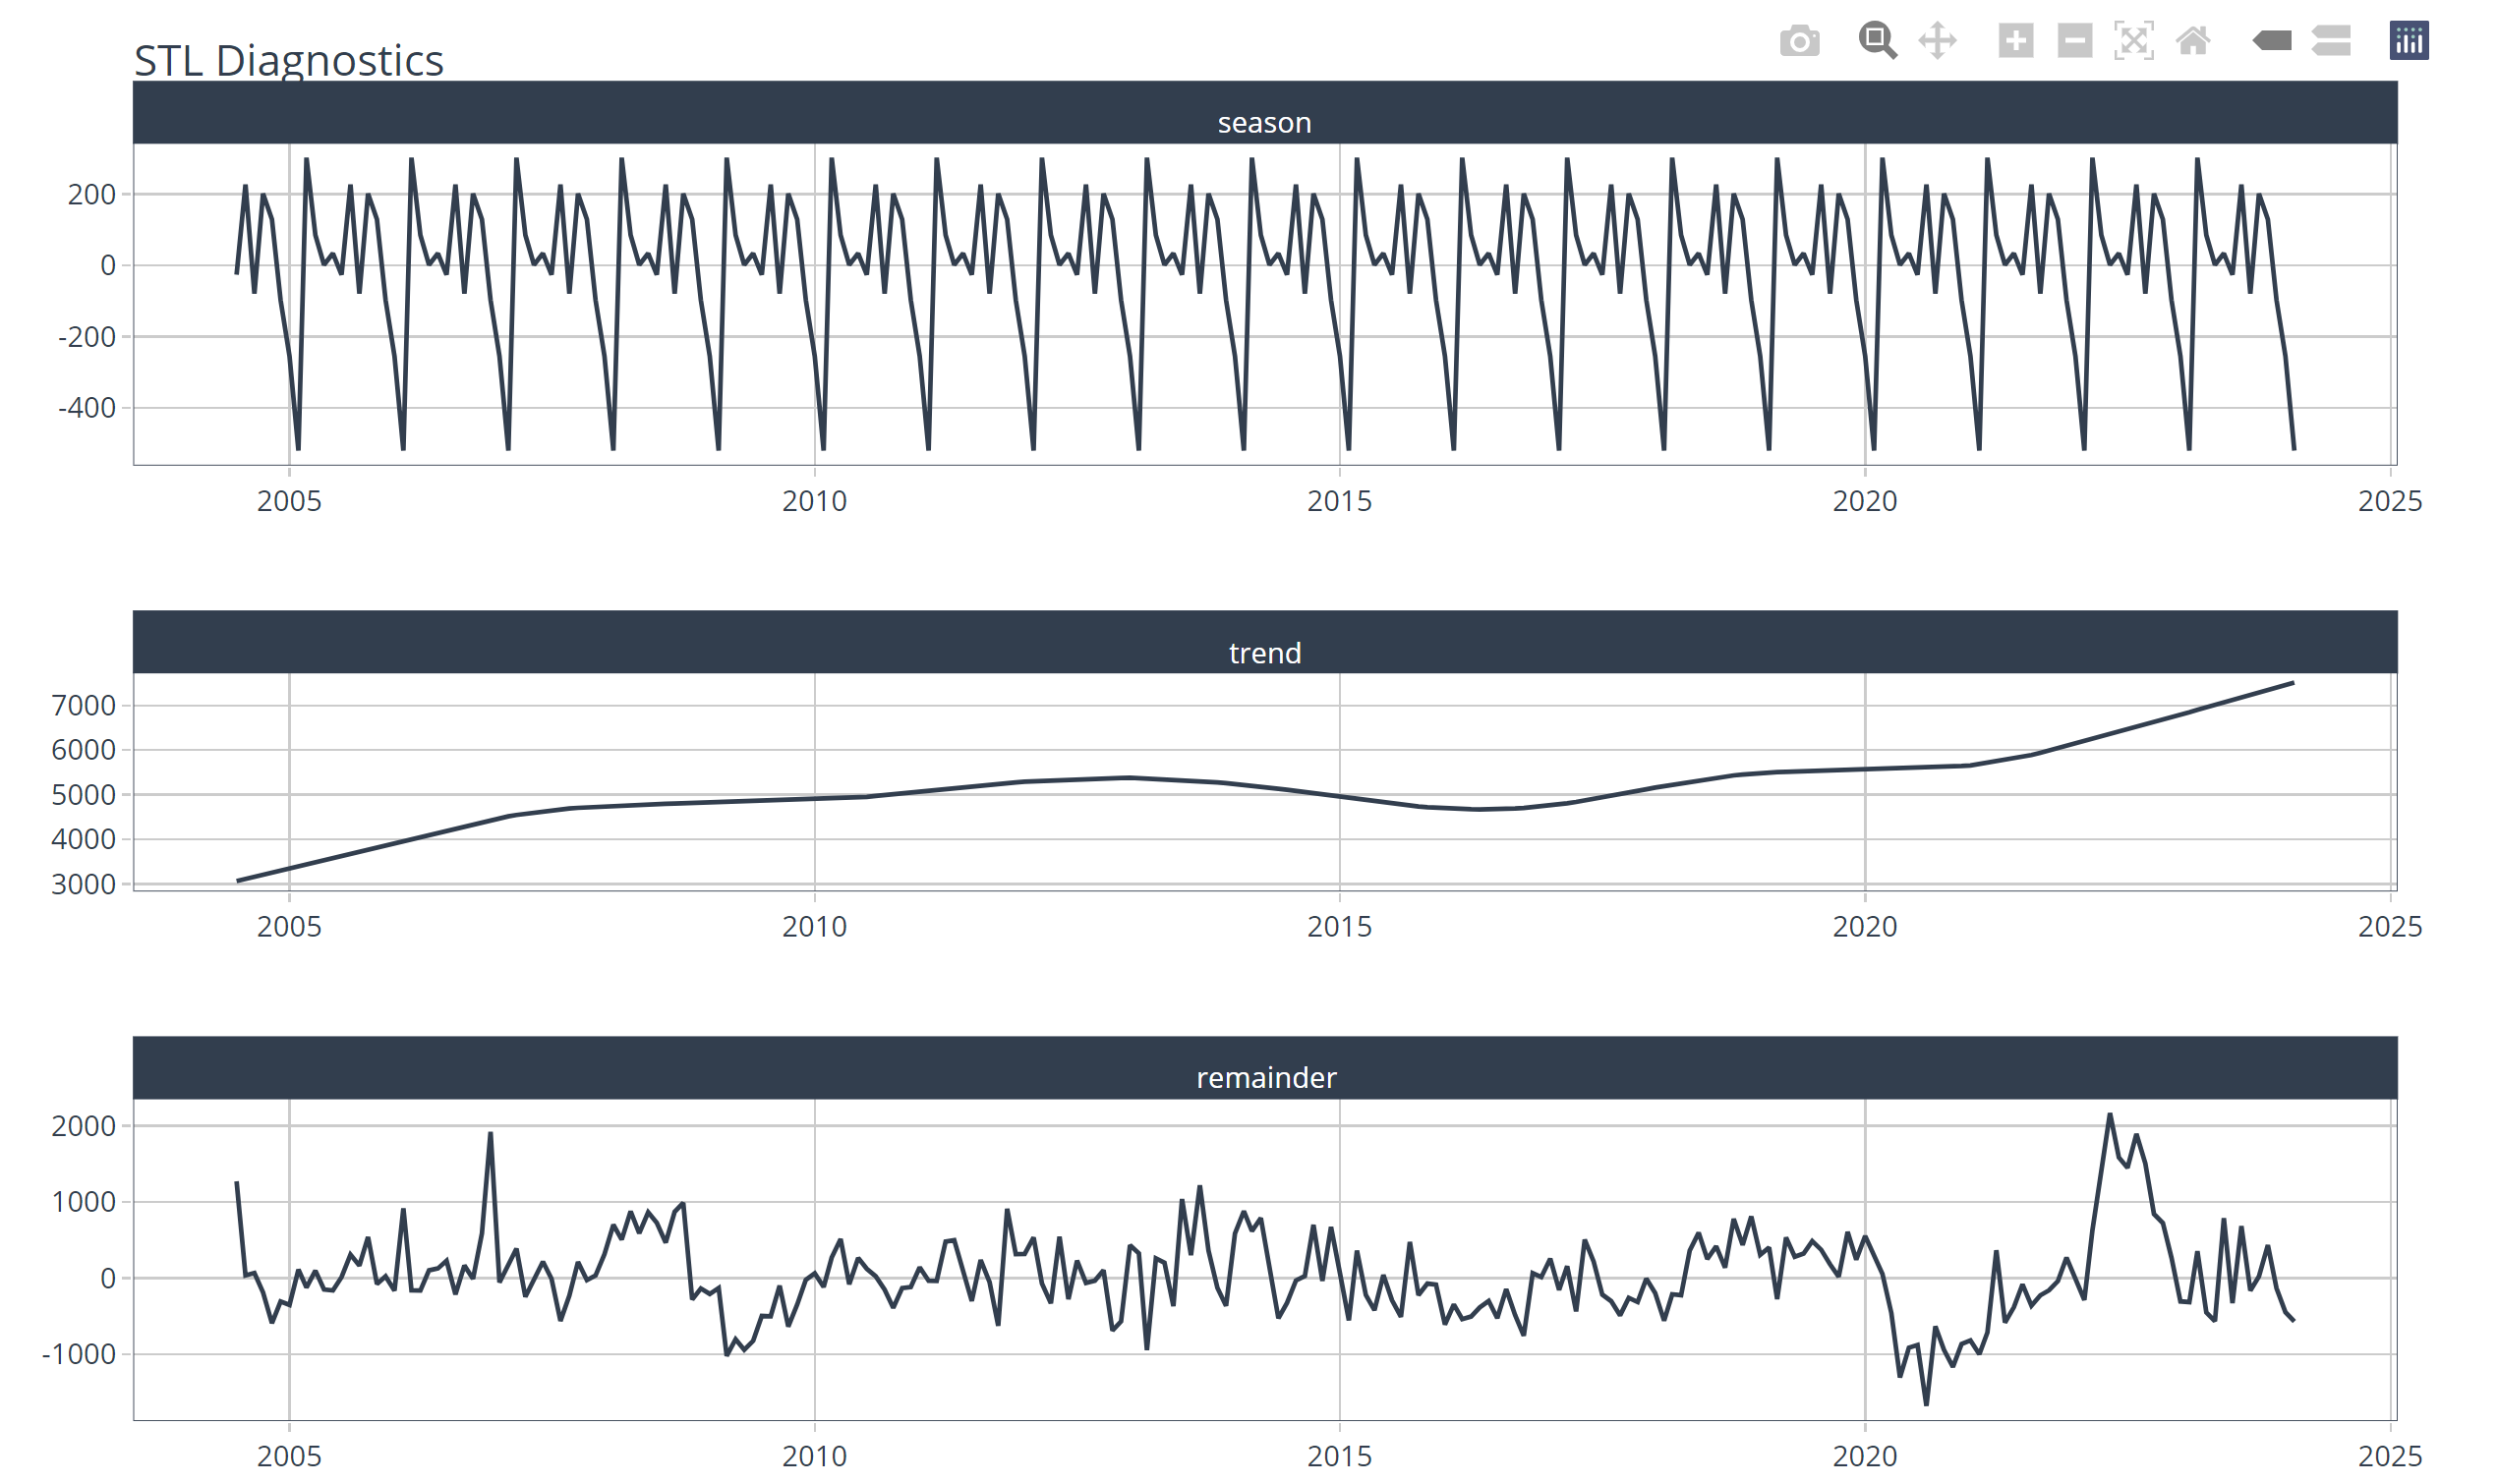
The STL diagnostic. The time series is decomposed into 3 part, seasonality, trend, and remainder. In this plot we show all 3 to let you further explore and understand the dataset.
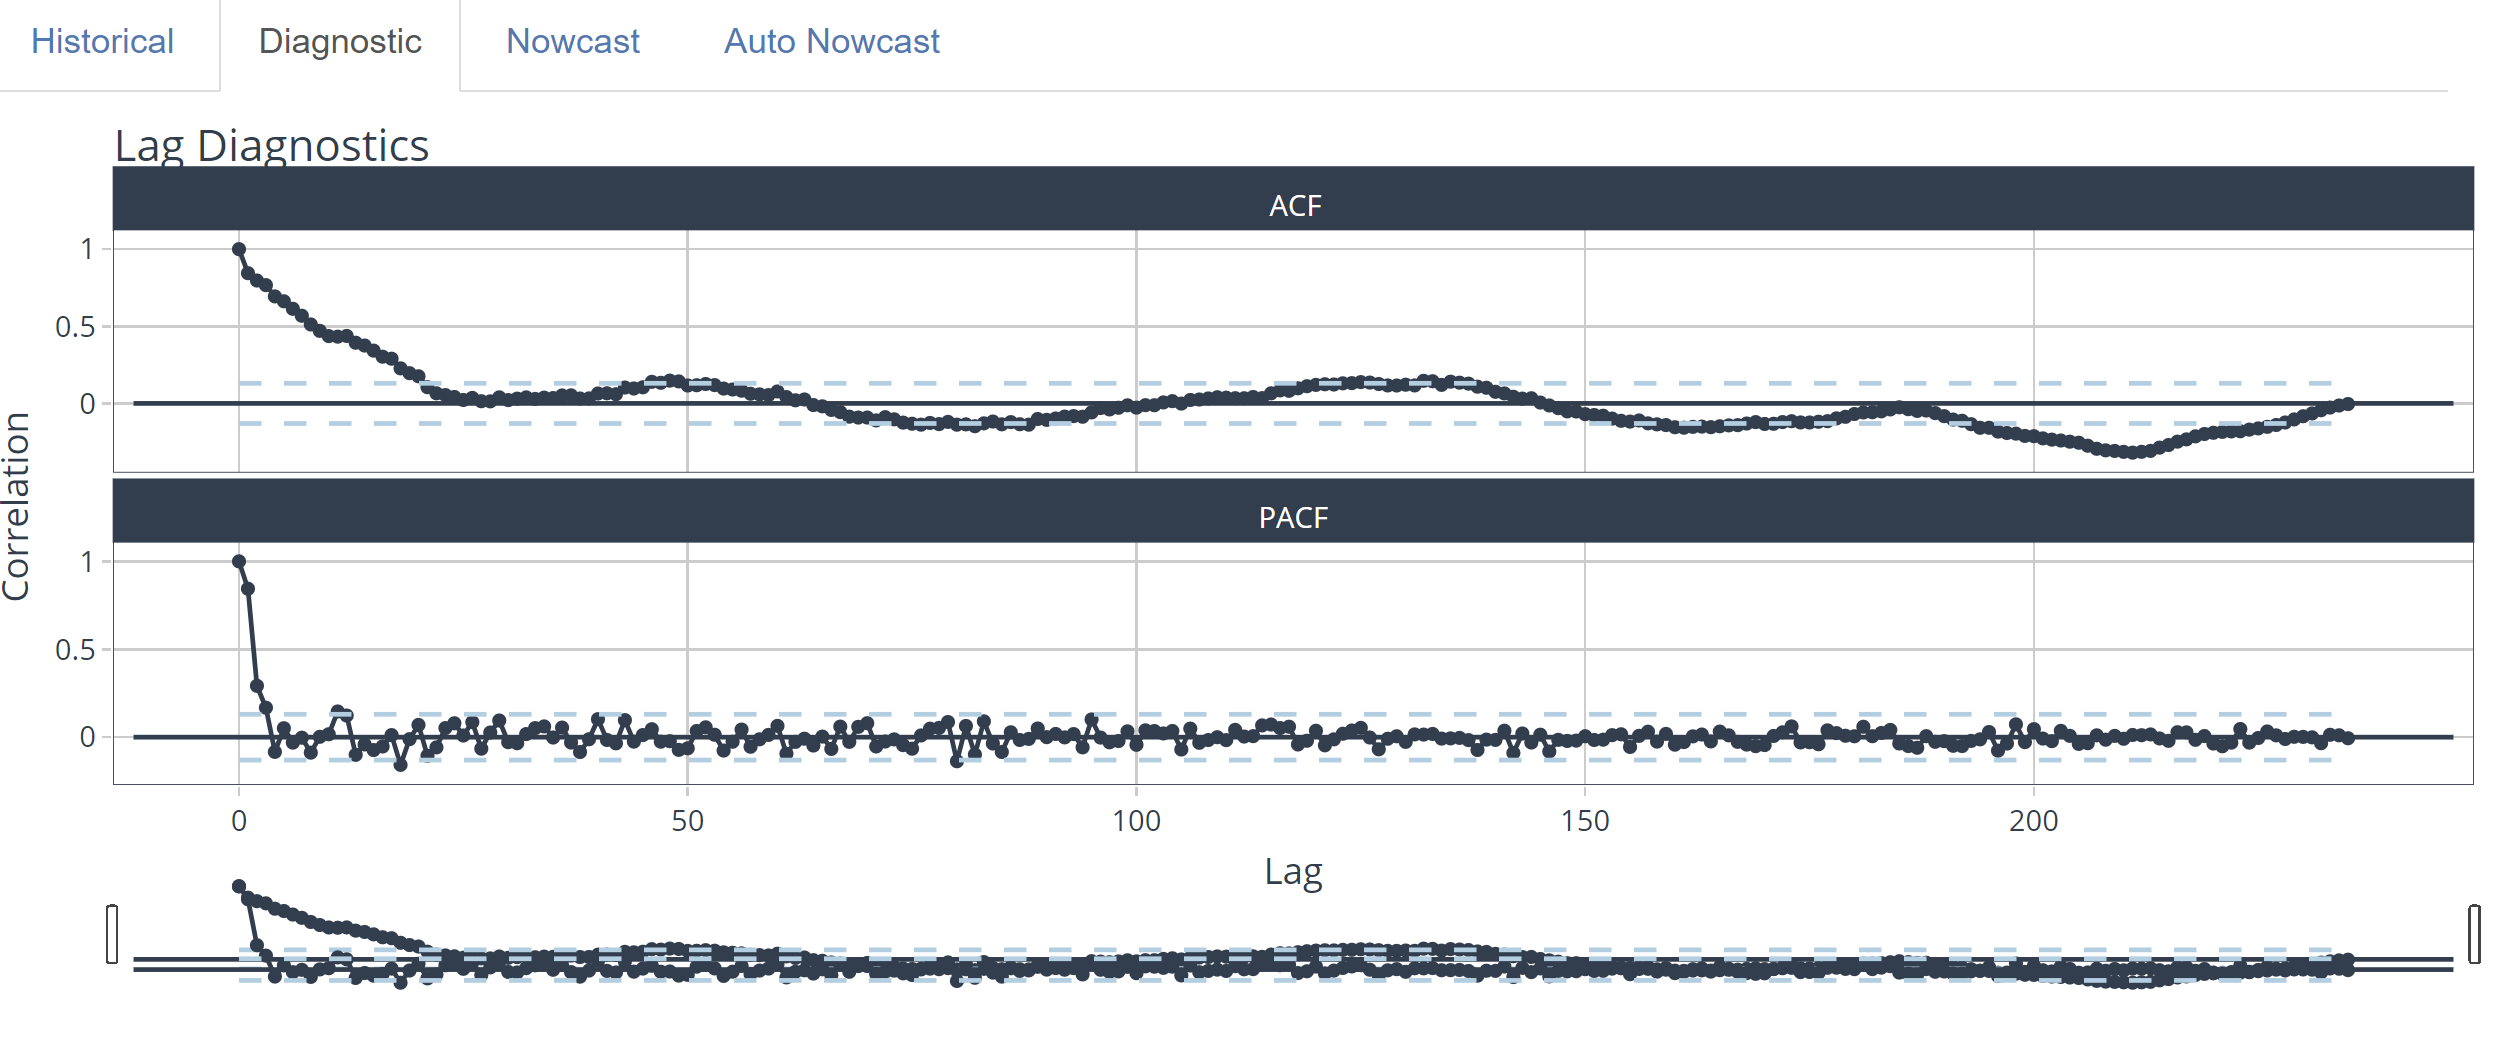
Diagnostic
Diagnostic page also consist of 2 main plot.
The Lag Diagnostic. This plot was to show correlation using ACF and PACF. Similar with the time series historical plot, a slider was given above to choose the plot range.
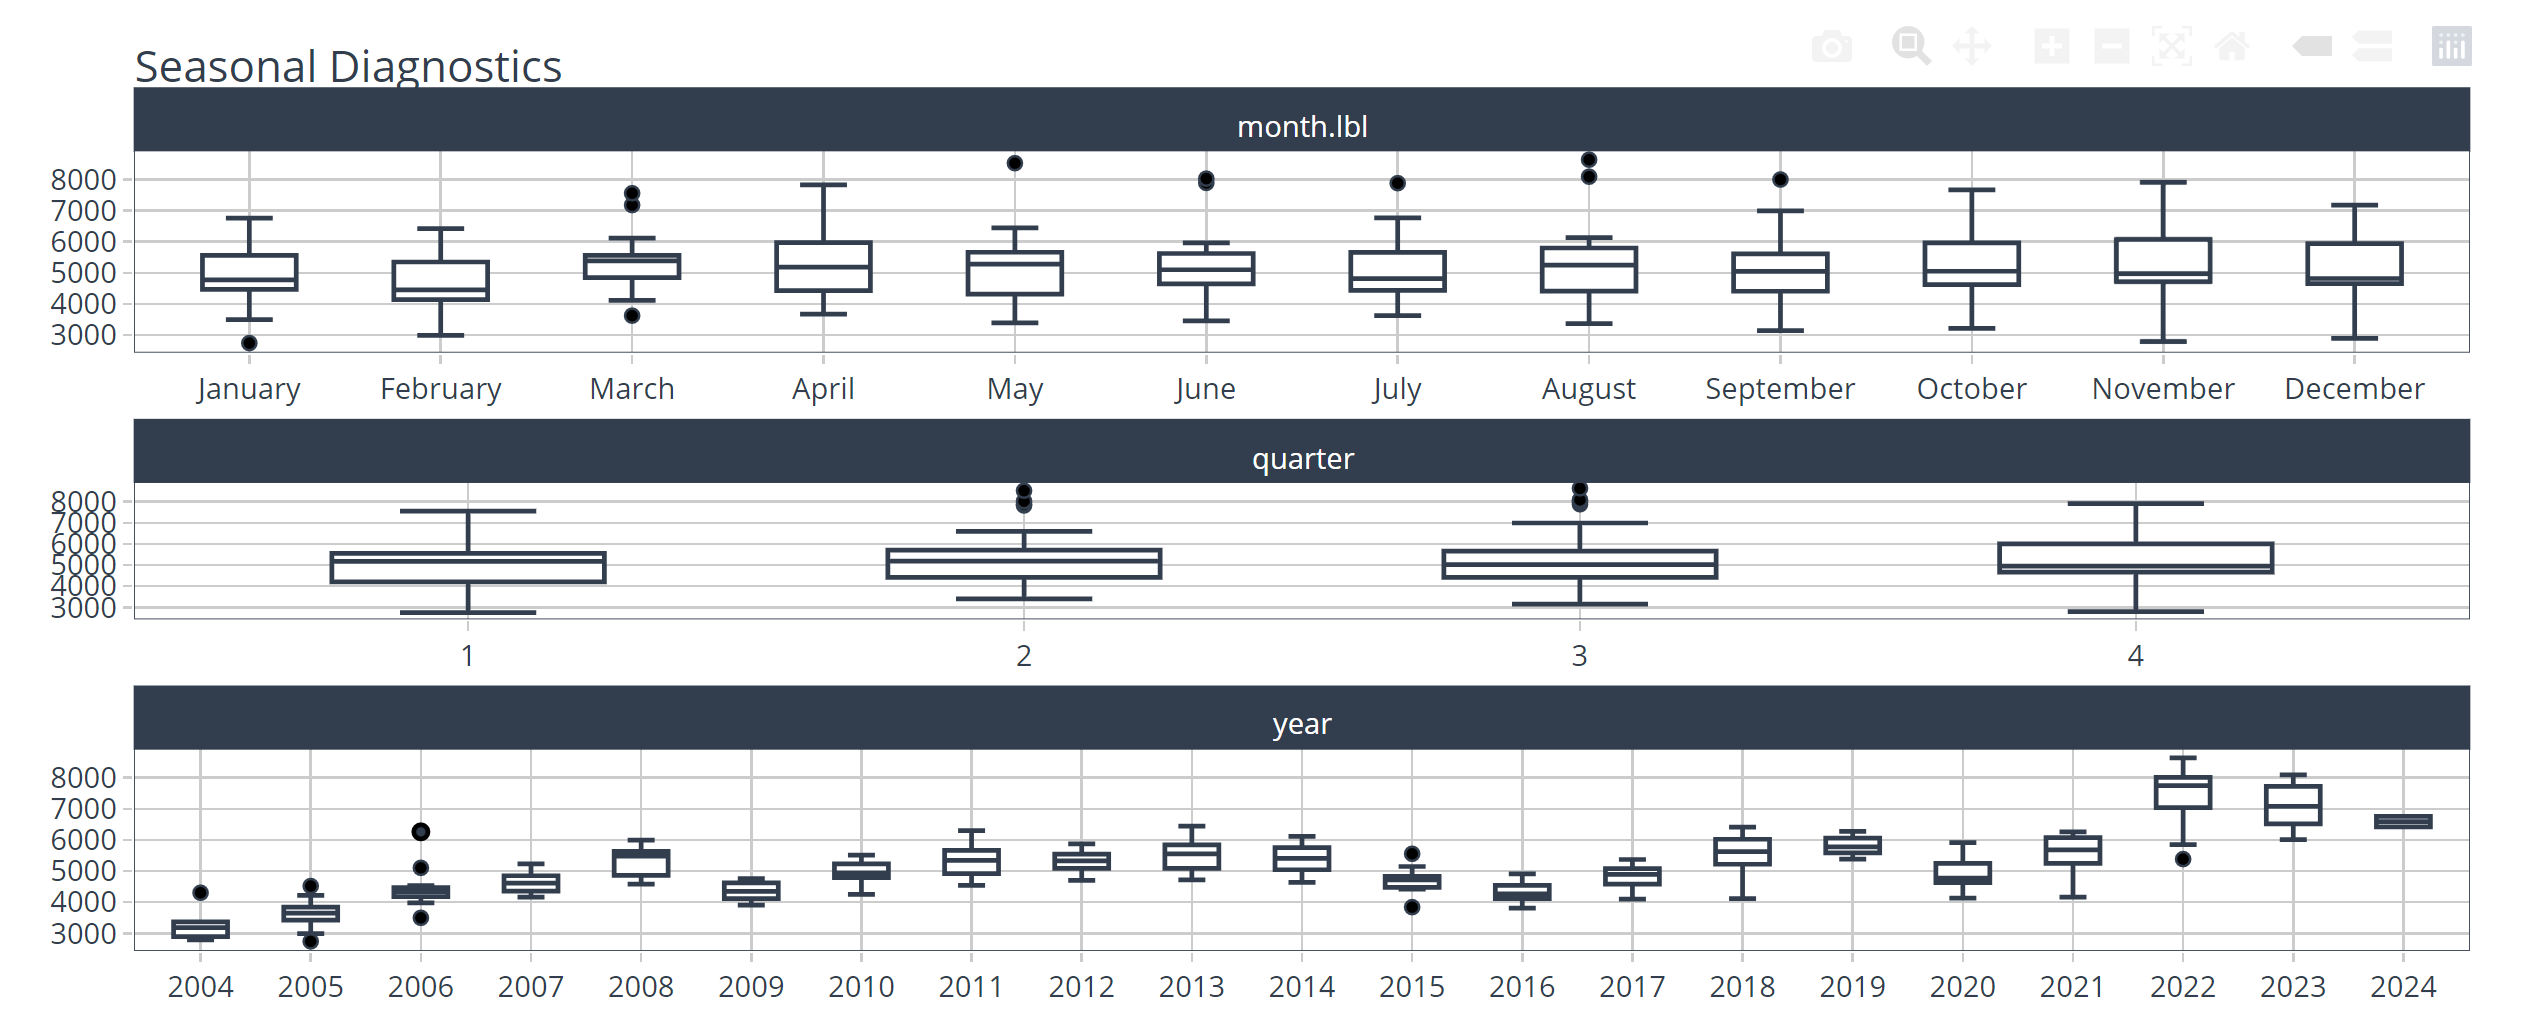
Seasonal Diagnostic as the second plot is to show the seasonal pattern such as monthly, quarterly, and yearly. It consist of boxplot containing the range of each period.
Nowcast
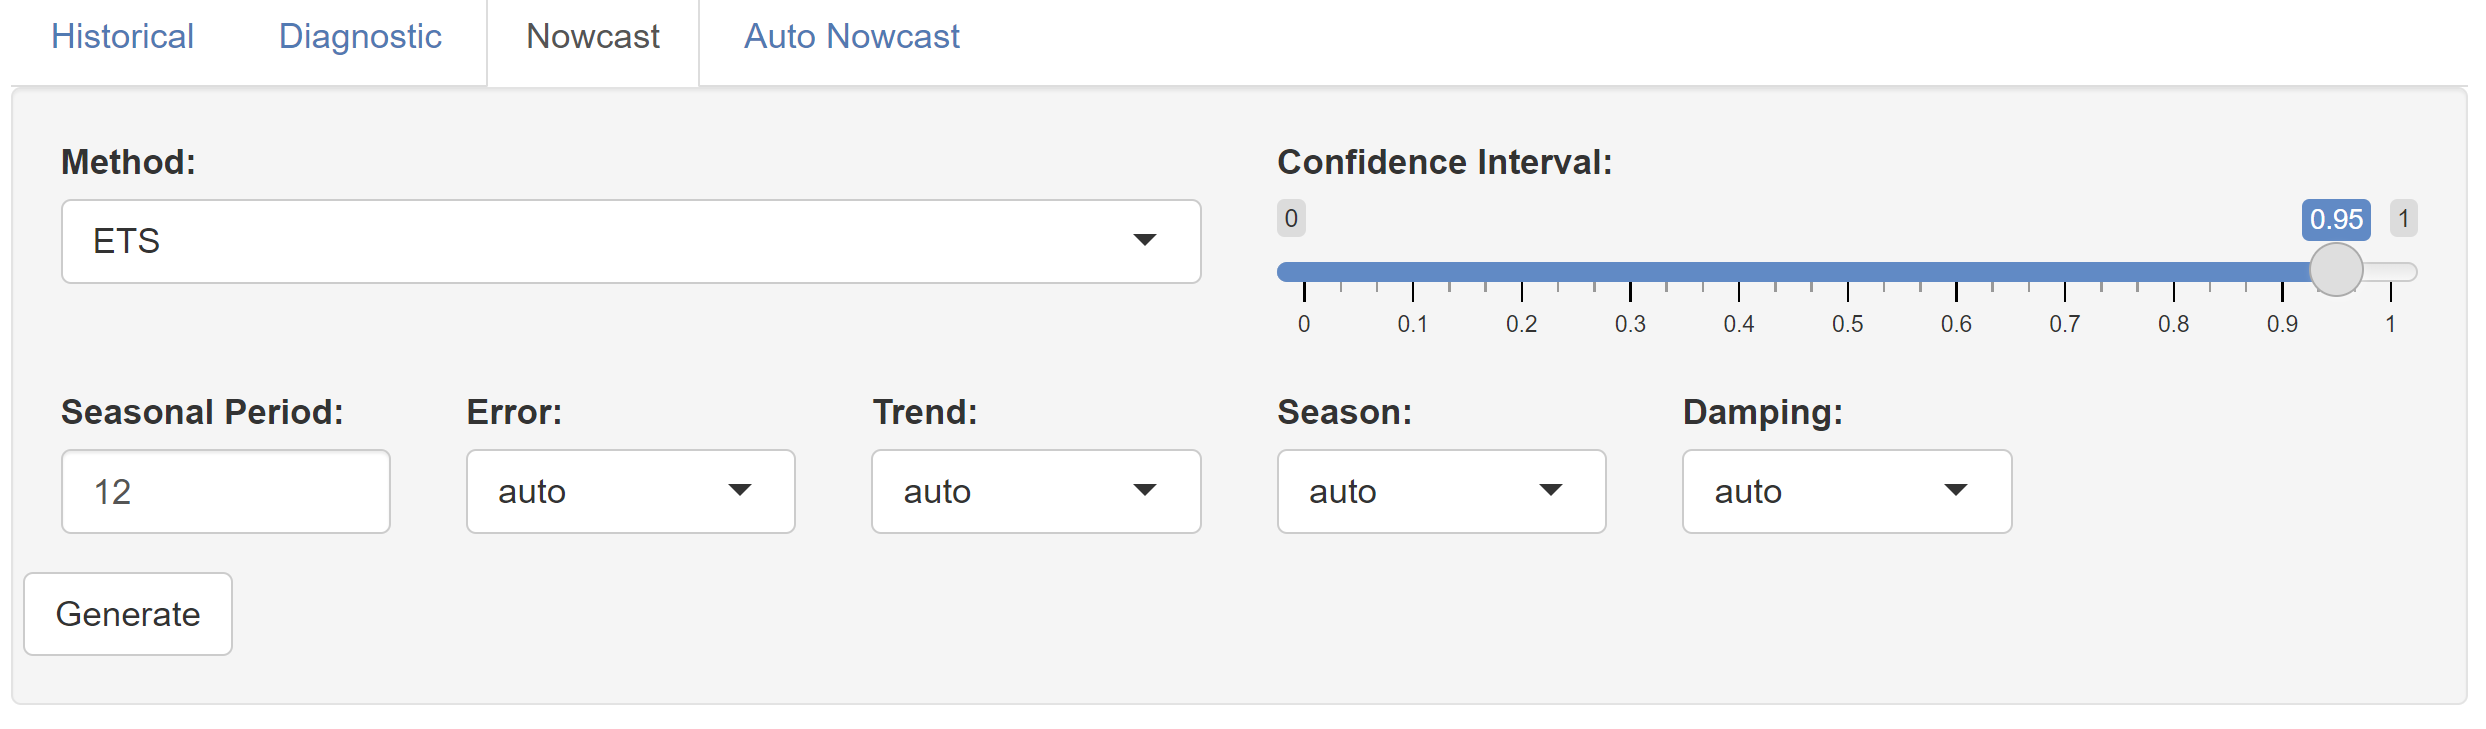
Nowcast is a page to do nowcast manually by generating a model based on your input parameter. There are 3 method of modelling available here:
ETS
Arima
Prophet
To choose the method, there will be another panel below the page title. The first row will show a single column to pick which method to be used. Then, row(s) consist of parameter options will appear based on what method was chosen, finally after all column chosen a generate button can pressed to generate the model and plot it.
In this page, the user are also required to pick a dataset and confidence interval using the slider input between 0 and 1.
The parameters are:
Seasonal Period: seasonal frequency (Number / 0 for “auto”)
Error: Error(remainder) part (auto/additive/multiplicative)
Trend: Trend part (auto/additive/multiplicative)
Season: Seasonal part (auto/additive/multiplicative)
Damping: auto/damped/none
-
All the parameter in arima need to be a number input. non seasonal inputs are following the pdq notation. seasonal inputs are following the PDQ notation.
Seasonal Period (Number / 0 for “auto”)
Non Seasonal AR(p)
Non Seasonal Differences(d)
Non Seasonal MA(q)
Seasonal AR(P)
Seasonal Differences(D)
Seasonal MA(Q)
Growth: to specify trend (logistic_cap/logistic_floor/linear)
Seasonality Yearly: toggle seasonal component for year to year (auto/TRUE/FALSE)
Seasonality Weekly: toggle seasonal component for week over week (auto/TRUE/FALSE)
Seasonality Daily: toggle seasonal component for day to day (auto/TRUE/FALSE)
Season: additive/multiplication
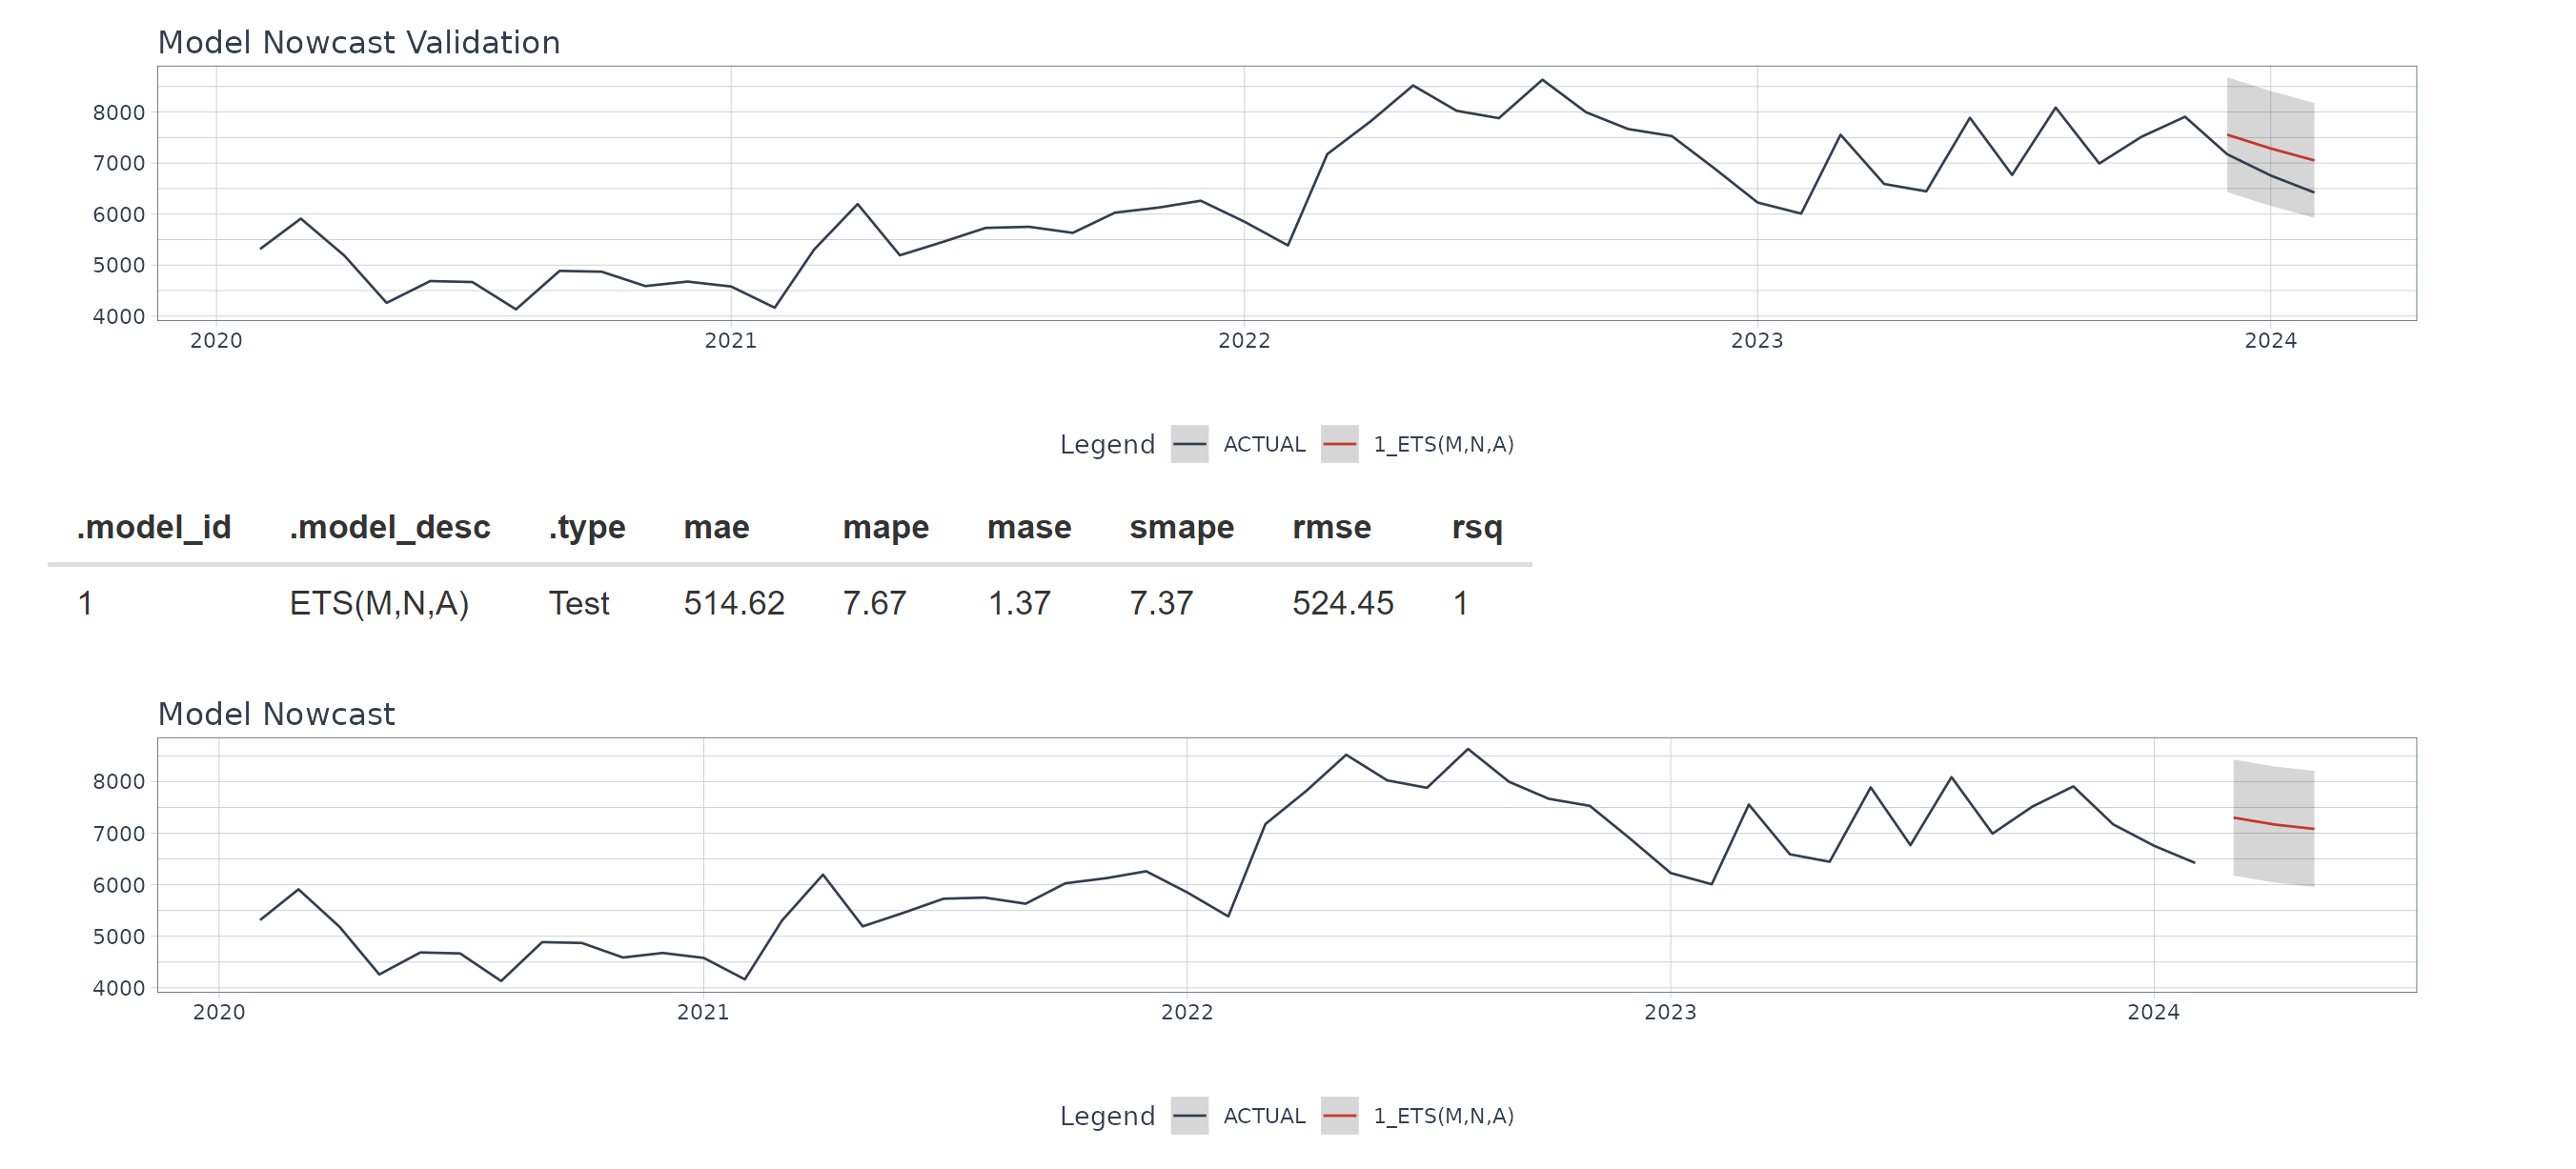
For this nowcast page there are 3 part:
The first is a plot for validation of the chosen model. showing the overlapping 3 month (between nowcasted and actual data)for all the dataset, except GDP which use 6 month (2 Quarter) since the GPD data was quarterly while the rest are monthly.
The second part is a table to show all the validation metric. they are:
MAE - Mean absolute error
MAPE - Mean absolute percentage error
MASE - Mean absolute scaled error
SMAPE - Symmetric mean absolute percentage error
RMSE - Root mean squared error
RSQ - R-squared
The last part is the plot showing the prediction for the next 6 months for GDP dataset or 3 months for the other dataset.
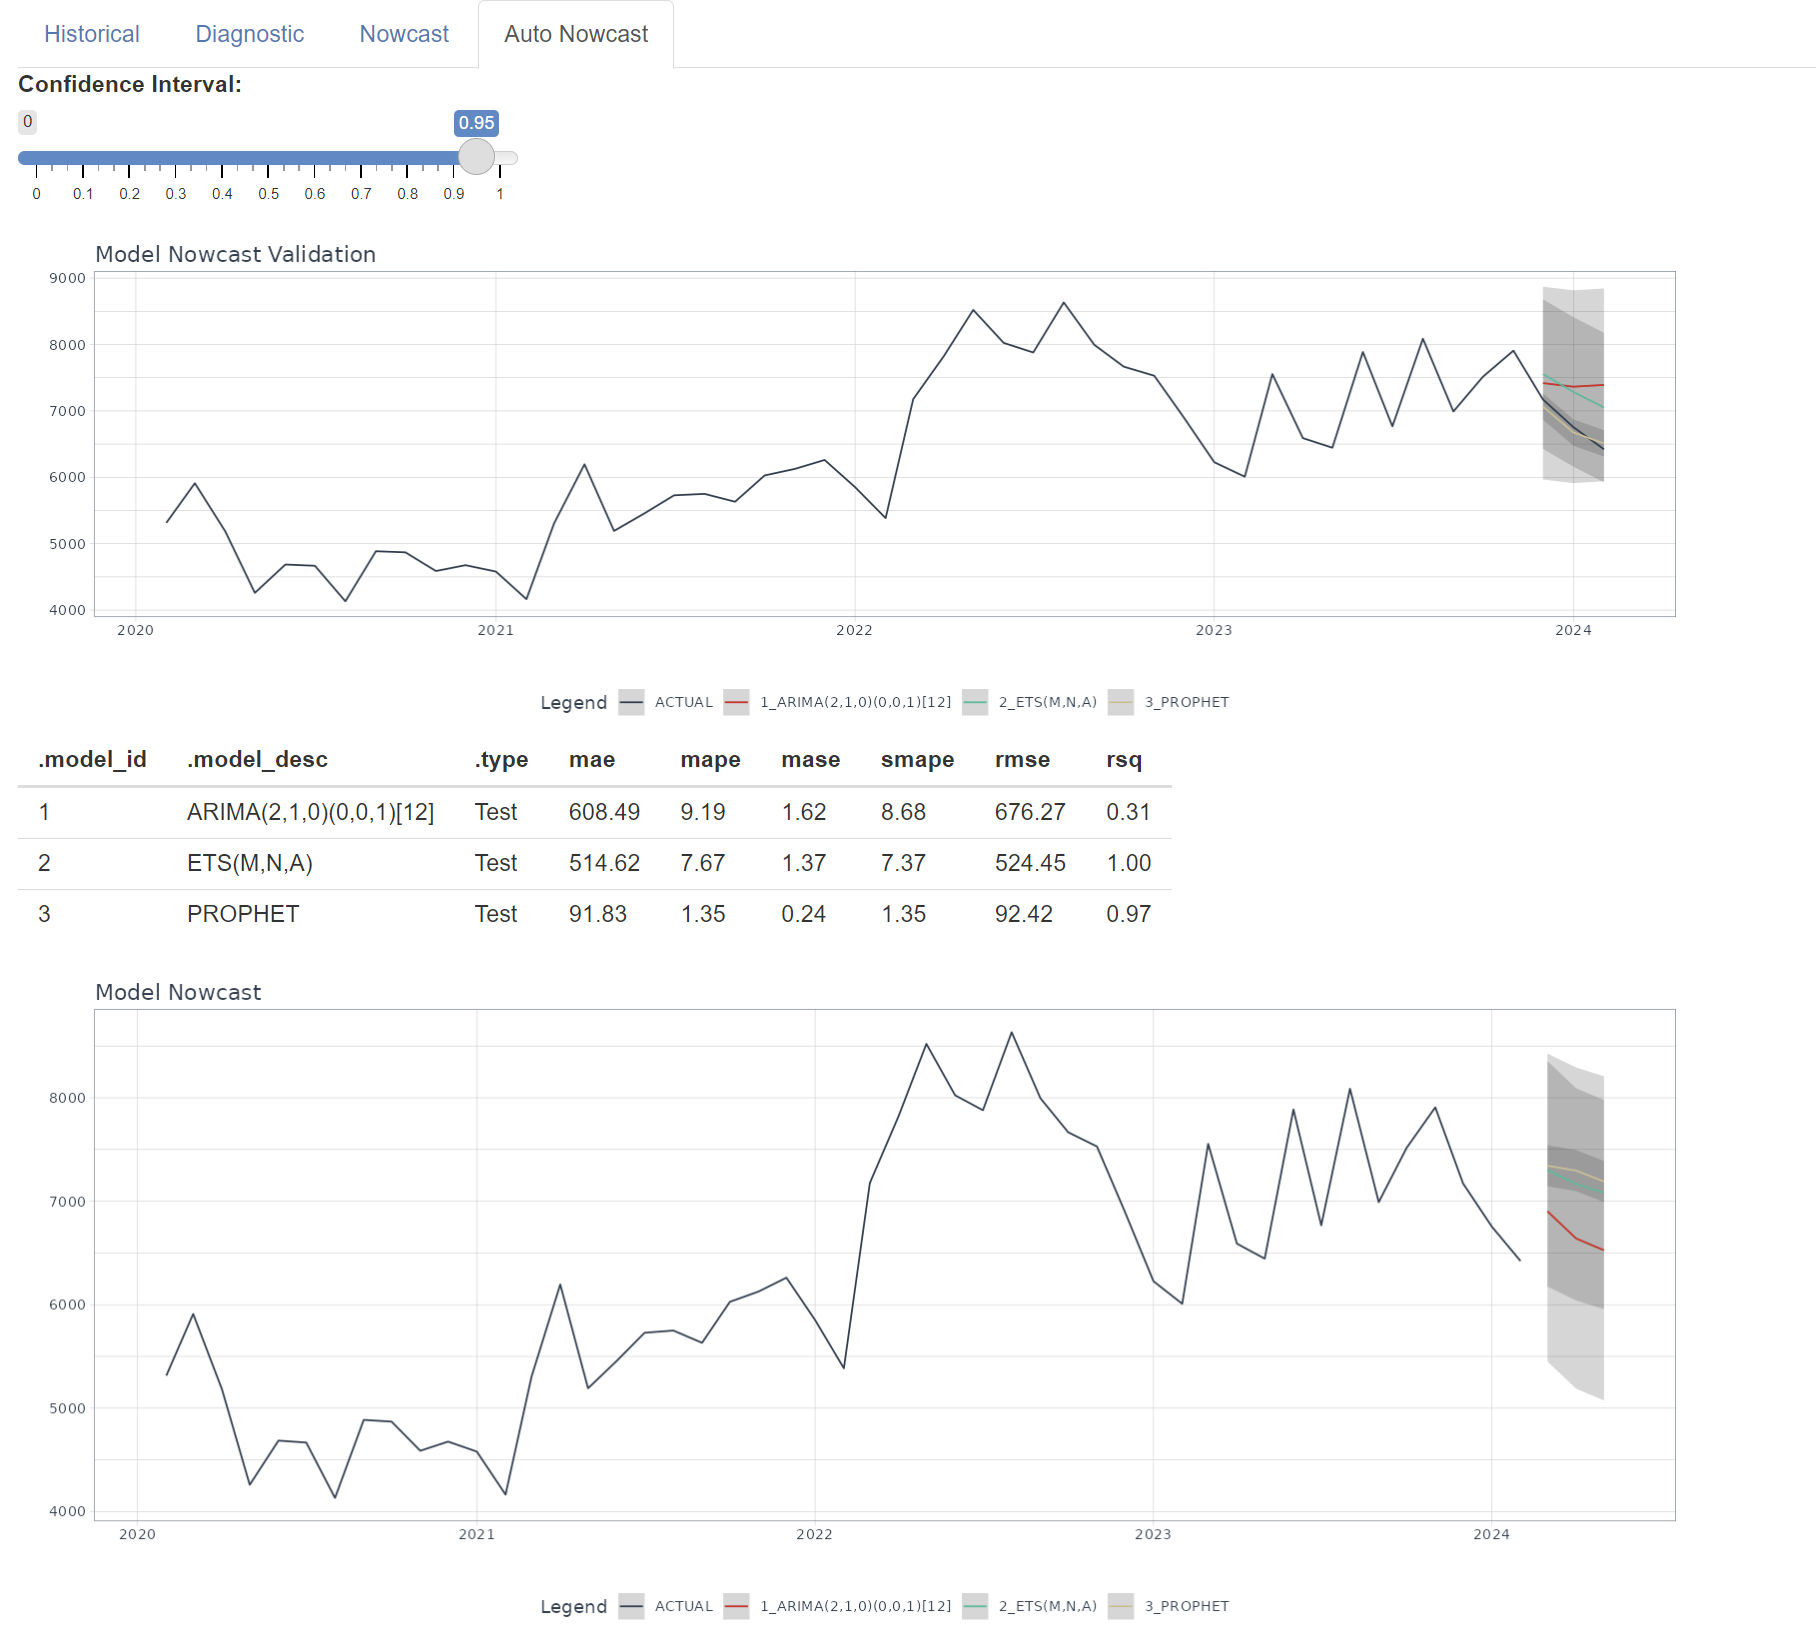
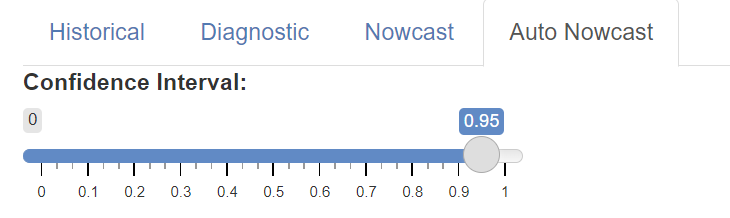
Auto Nowcast
This page will create 3 models for each method. However, the difference in between the model in this page and previous nowcast page is that th parameter are filled automatically by the system to choose the best model available.
The input for this page is the same as historical and diagnostic page which are the dataset choice with addition of confidence interval using the slider input between 0 and 1.
Similar with Nowcast page this page consist of 3 part:
The first is a plot for validation of the 3 auto model. showing the overlapping 3 month (between nowcasted and actual data)for all the dataset, except GDP which use 6 month (2 Quarter) since the GPD data was quarterly while the rest are monthly.
The second part is a table to show all the validation metric. they are:
MAE - Mean absolute error
MAPE - Mean absolute percentage error
MASE - Mean absolute scaled error
SMAPE - Symmetric mean absolute percentage error
RMSE - Root mean squared error
RSQ - R-squared
In this table we could also see the parameter that was chosen the best for the arima model and the ets model. In the model description can be seen the first bracket of arima is pdq notation followed by PDQ and seasonal period. While for the ETS, each character represent error, trend, and seasonality respectively (m = multiplicative, n = none, a = additive).
The last part is the plot showing the prediction for the next 6 months for GDP dataset or 3 months for the other dataset.